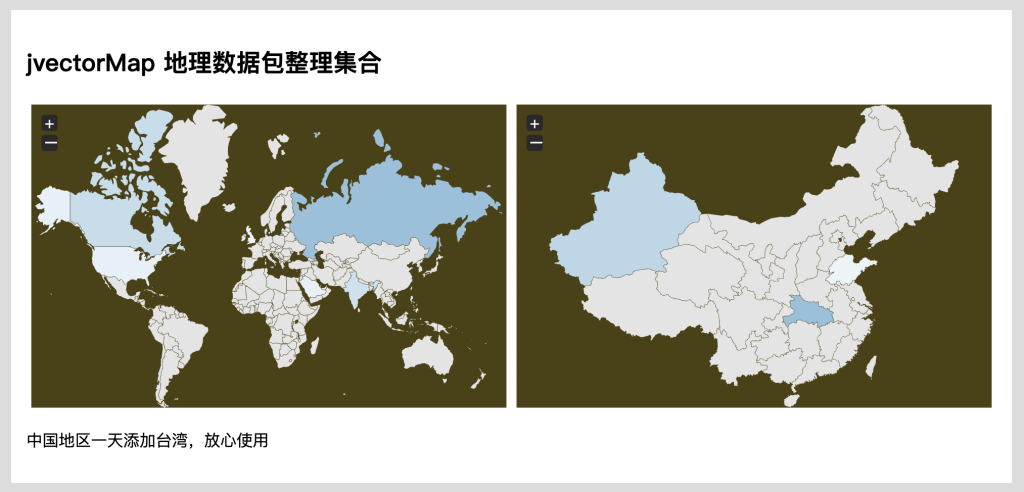
jvectormap 地图数据整理 一些年久失修的好东西
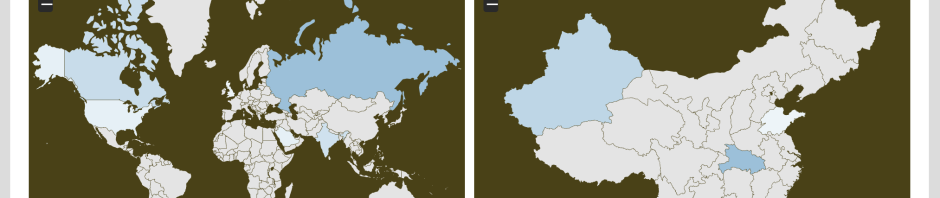
jVectorMap 是一个基于矢量、跨浏览器和跨平台的组件,用于在 Web 上进行与地理相关的交互式数据可视化。它提供了许多功能,如平滑缩放和平移、完全可定制的样式、标记、标签和工具提示。
您可以在 官方网站上找到地图、文档、示例等。示例子位于 ??
安装
$ npm install jvectormap-maps-data
$ git clone [email protected]:shiguangxiaotou3/jvectormap-maps-data.git
$ composer require shiguangxiaotou/jvectormap-maps-data
使用
<!DOCTYPE html>
<html lang="en">
<head>
    <meta charset="UTF-8">
    <title>Title</title>
    <link rel="stylesheet" href="./../dist/css/jquery-jvectormap.css">
</head>
<body>
     <div id="world-map" style="height: 500px; width: 100%;"></div>
</body>
<!-- jvectormap -->
<script src="./../node_modules/jquery/dist/jquery.js"></script>
<script src="./js/jquery-jvectormap-1.2.2.min.js"></script>
<script src="./js/jquery-mousewheel.js"></script>
<script>
    jQuery(function ($) {
        let visitorsData = {
            US: 398, GB: 320, RU: 3000,
            SA: 400, CA: 1000, IN: 800
        };
        $('#world').vectorMap({
            map: 'world-merc',
            backgroundColor: 'transparent',
            regionStyle: {
                initial: {
                    fill: '#e4e4e4',
                    'fill-opacity': 1,
                    stroke: 'none',
                    'stroke-width': 0,
                    'stroke-opacity': 1
                }
            },
            series: {
                regions: [
                    {
                        values: visitorsData,
                        scale: ['#ebf4f9', '#92c1dc'],
                        normalizeFunction: 'polynomial'
                    }
                ]
            },
            onRegionLabelShow: function (e, el, code) {
                if (typeof visitorsData[code] != 'undefined')
                    el.html(el.html() + ': ' + visitorsData[code] + ' new visitors');
            }
        });
</script>
</html>